Basic Information
Title: Raster and Chance 9 x 7 Portfolio
Artist(s):
Gerhard Von Graevenitz
Date Created: 1979
Unframed Dimensions: 27.5 x 27.5 in.
Medium: serigraph on paper
Inventory ID: VonGreaventiz-1979-01
Description
A portfolio of 63 serigraphs created after original unique computer-generated plotter drawings, accompanied by a title page, a colophon text page written by the artist, and a serigraph thumbnail index, housed in a custom made wooden box. This was the artist’s copy of the portfolio and contains an additional special color trial proof of serigraph Part 8 #3.
Published and printed in an edition of 20 on Siris 260 paper by Marc Hofstättler at Editions Media, Neuchatel, Switzerland, October 1979.
The colophon text:
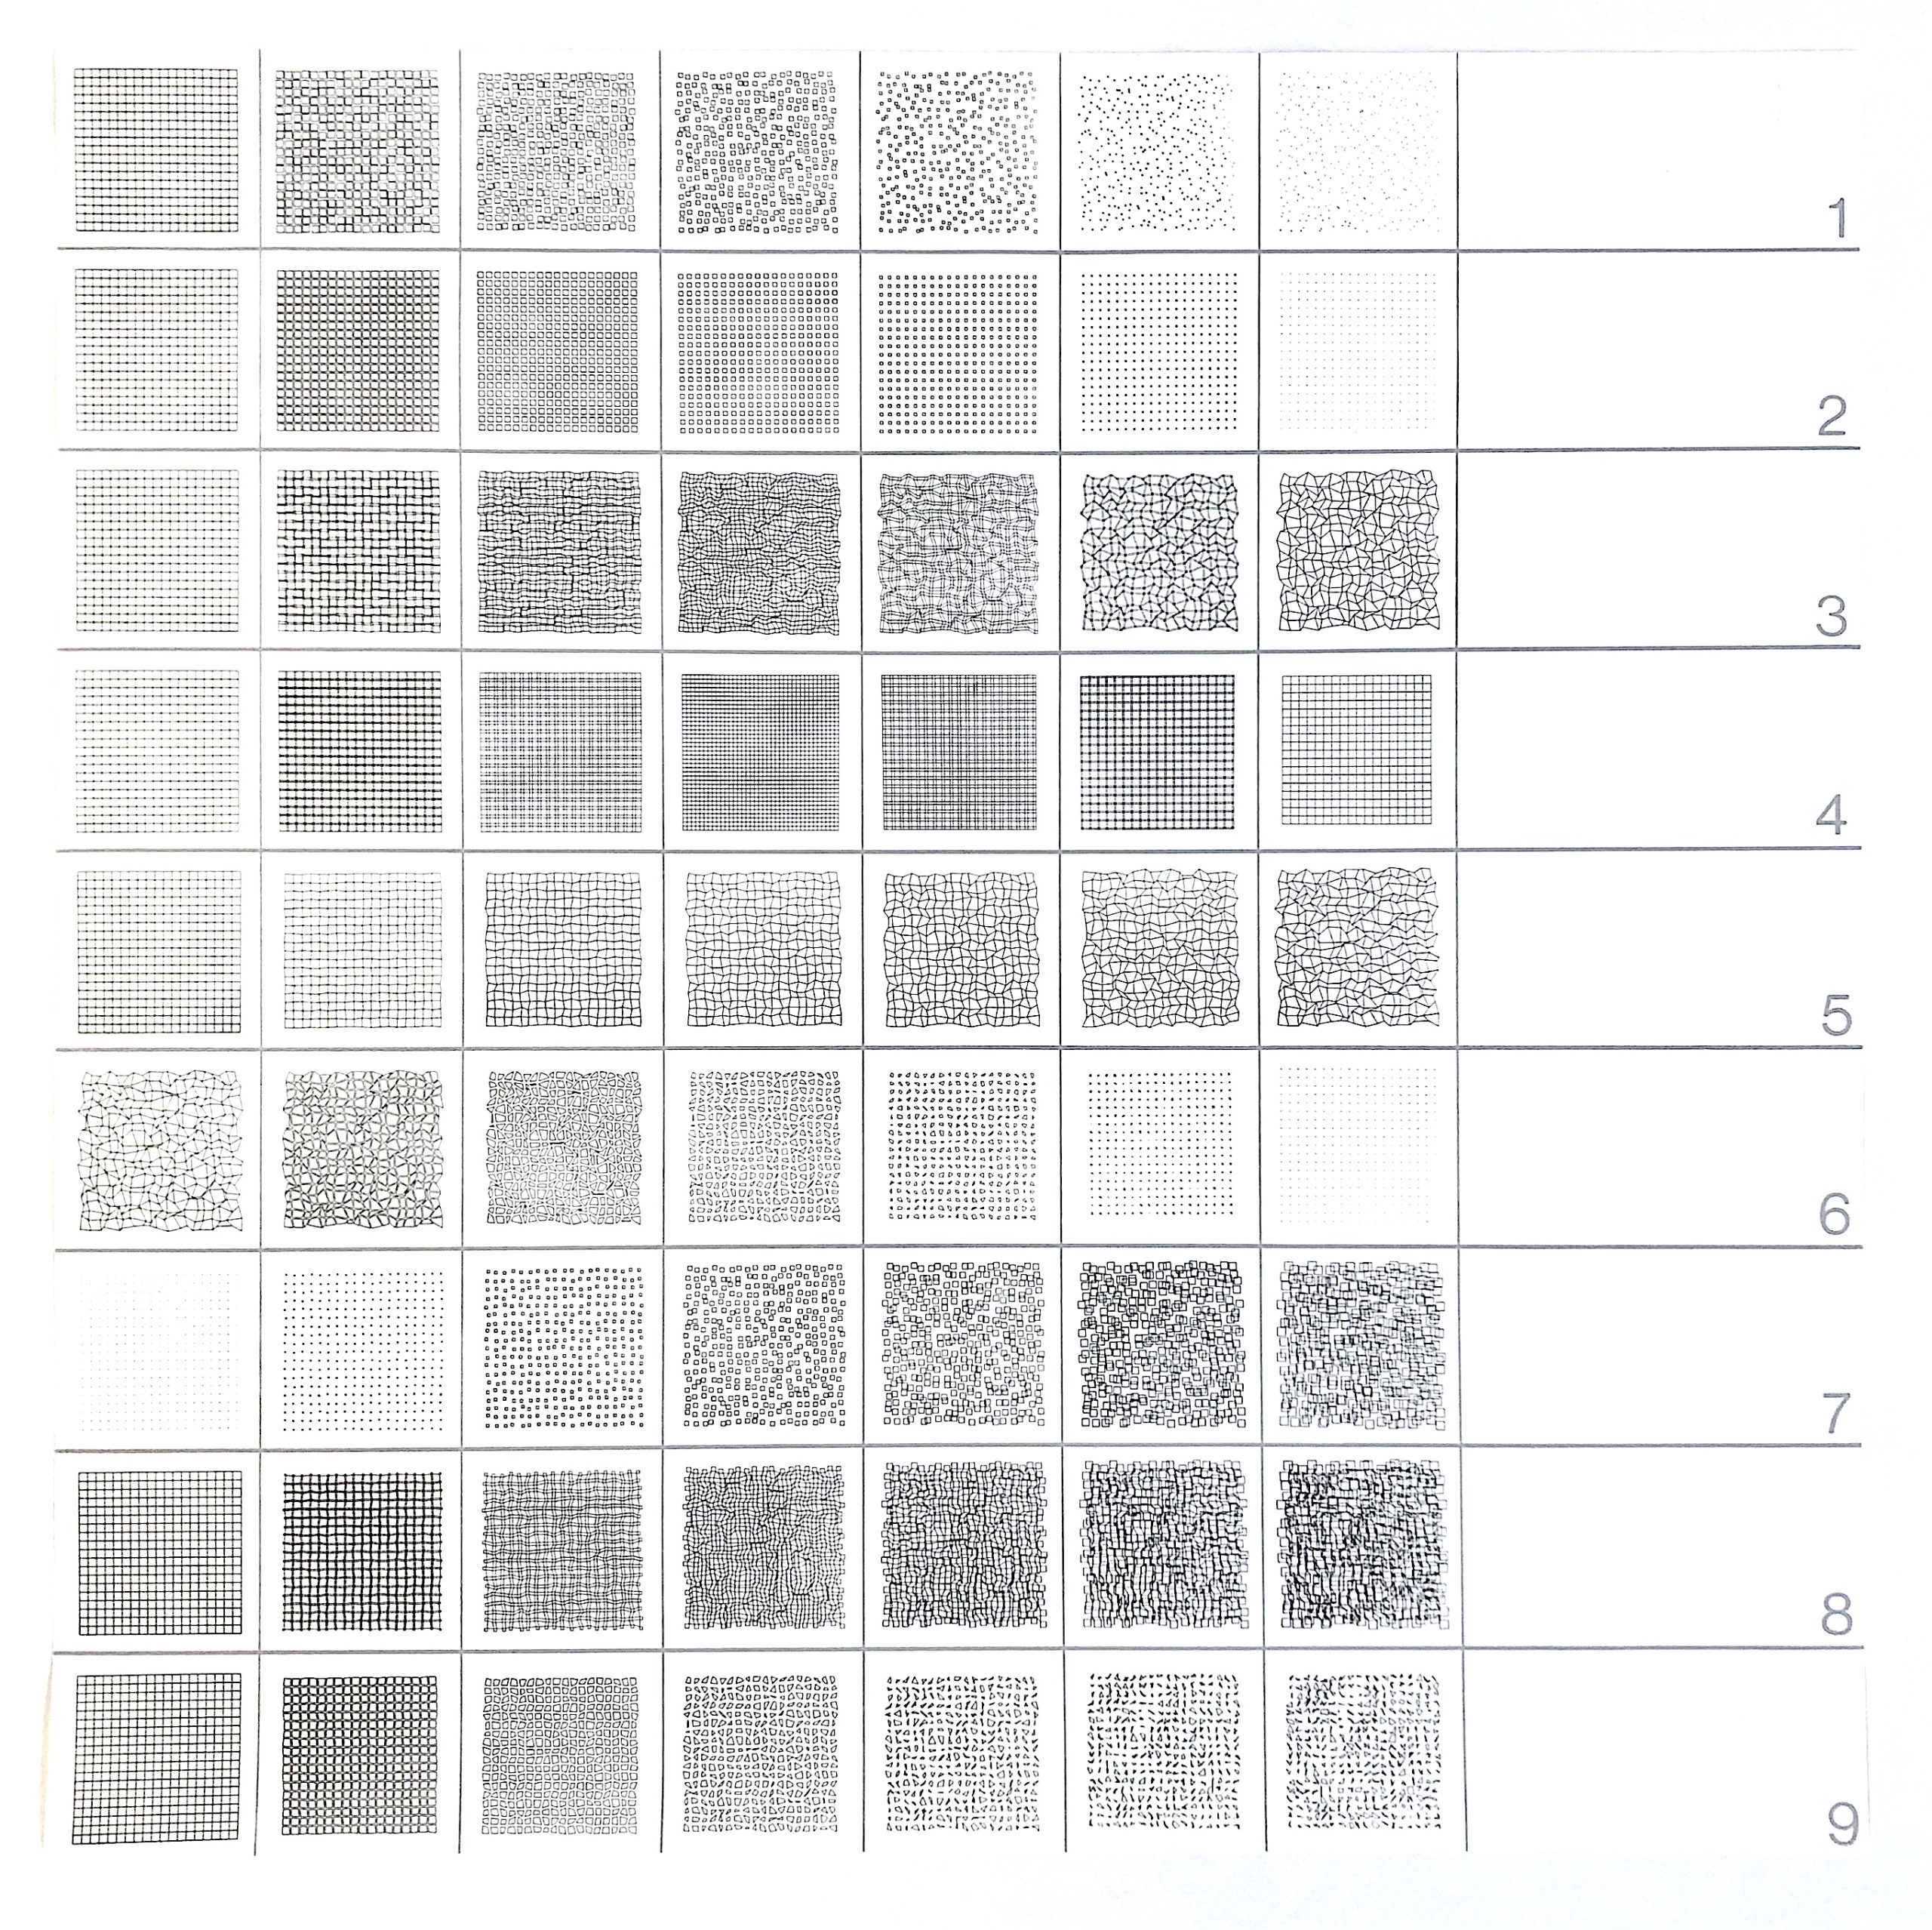
Series of 63 screen prints “raster and chance”
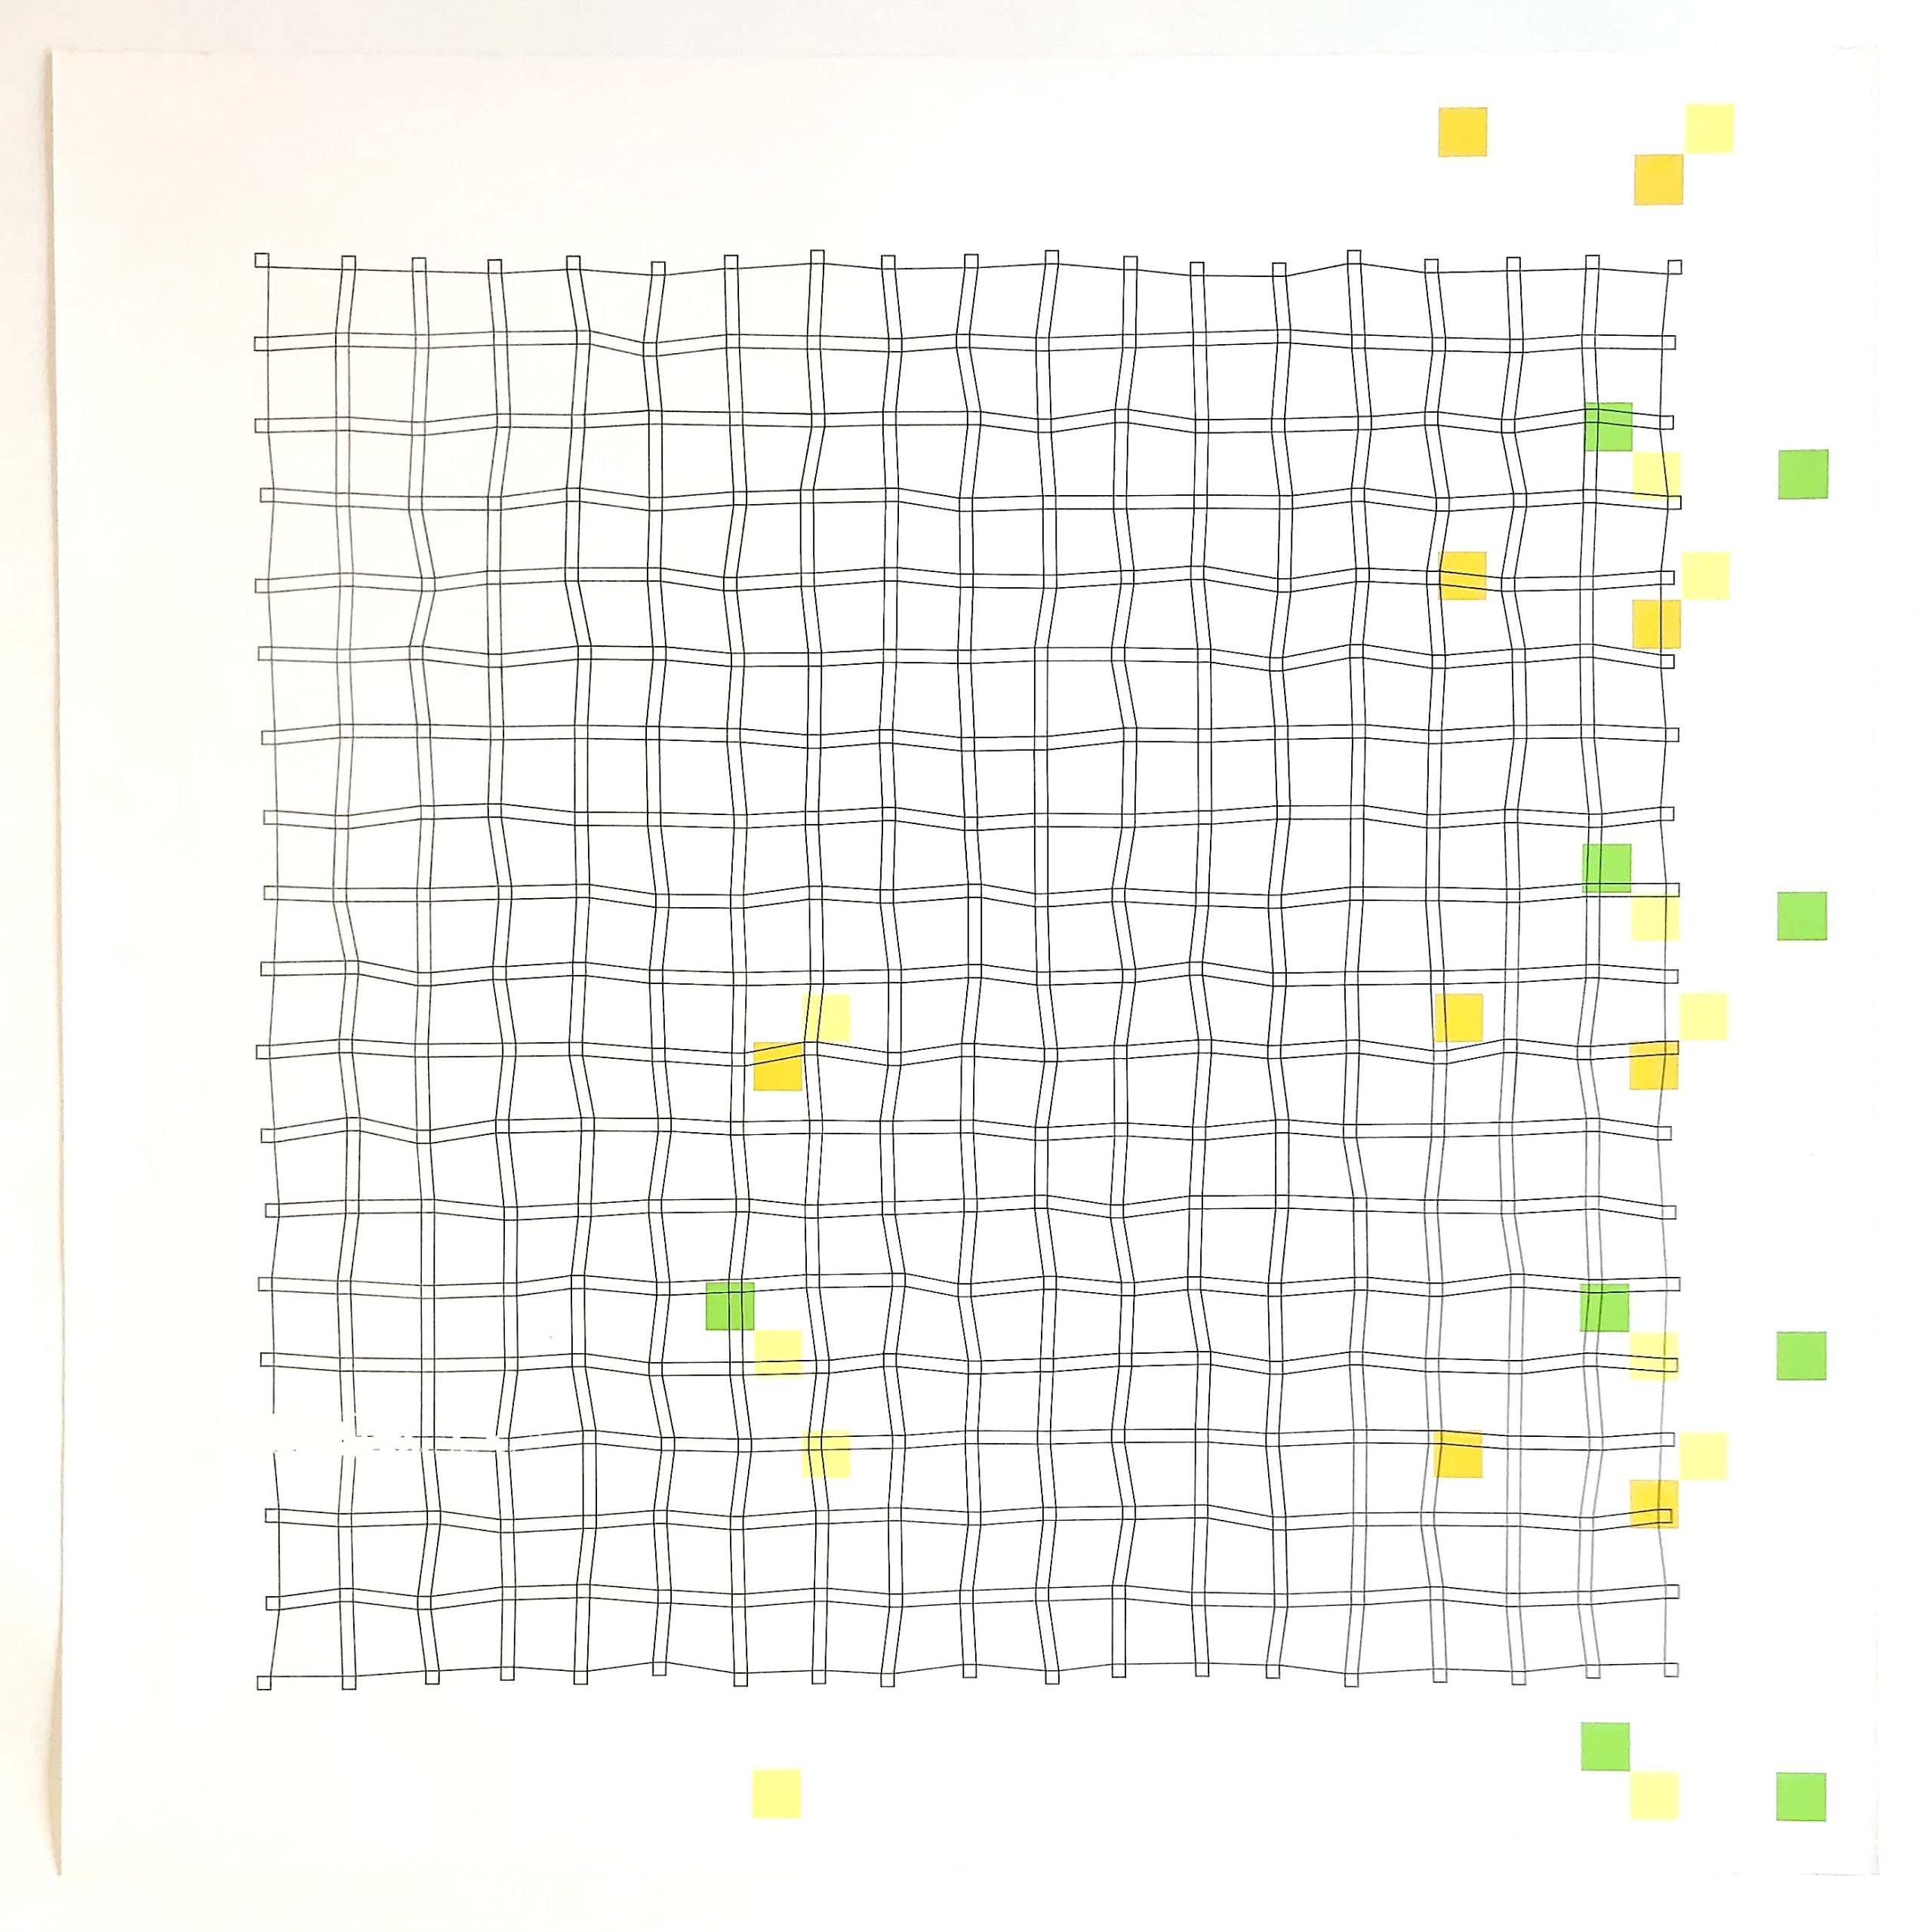
The series is based on a square raster and on a chance distribution of points.
A raster can be described by its structure or by its elements. So the square grid can be built by a band of straight lines which is superimposed at 90” by a band of straight lines or by piling up of squares. The difference will be clear by comparing a raster of squares with a raster of hexagons. The first is easier to be seen as a superimposition of straight lines, the second is easier to be seen as a pile of hexagons. This is not only because of the uninterrupted straight lines of the square grid, but also because the square has a more open form than the hexagon. In this series the two possibilities are used. The raster of this series consists of 20 horizontal and 20 vertical straight lines at the same distance or of 19 x 19 equal squares.
Opposite to the regular structure of the raster there is a chance distribution of points. Each square of the grid forms a field of probability in which at a random place a point is determined. a point is (according to the two definitions of the grid) either seen as the place where two straight lines cross or as the center of a square.
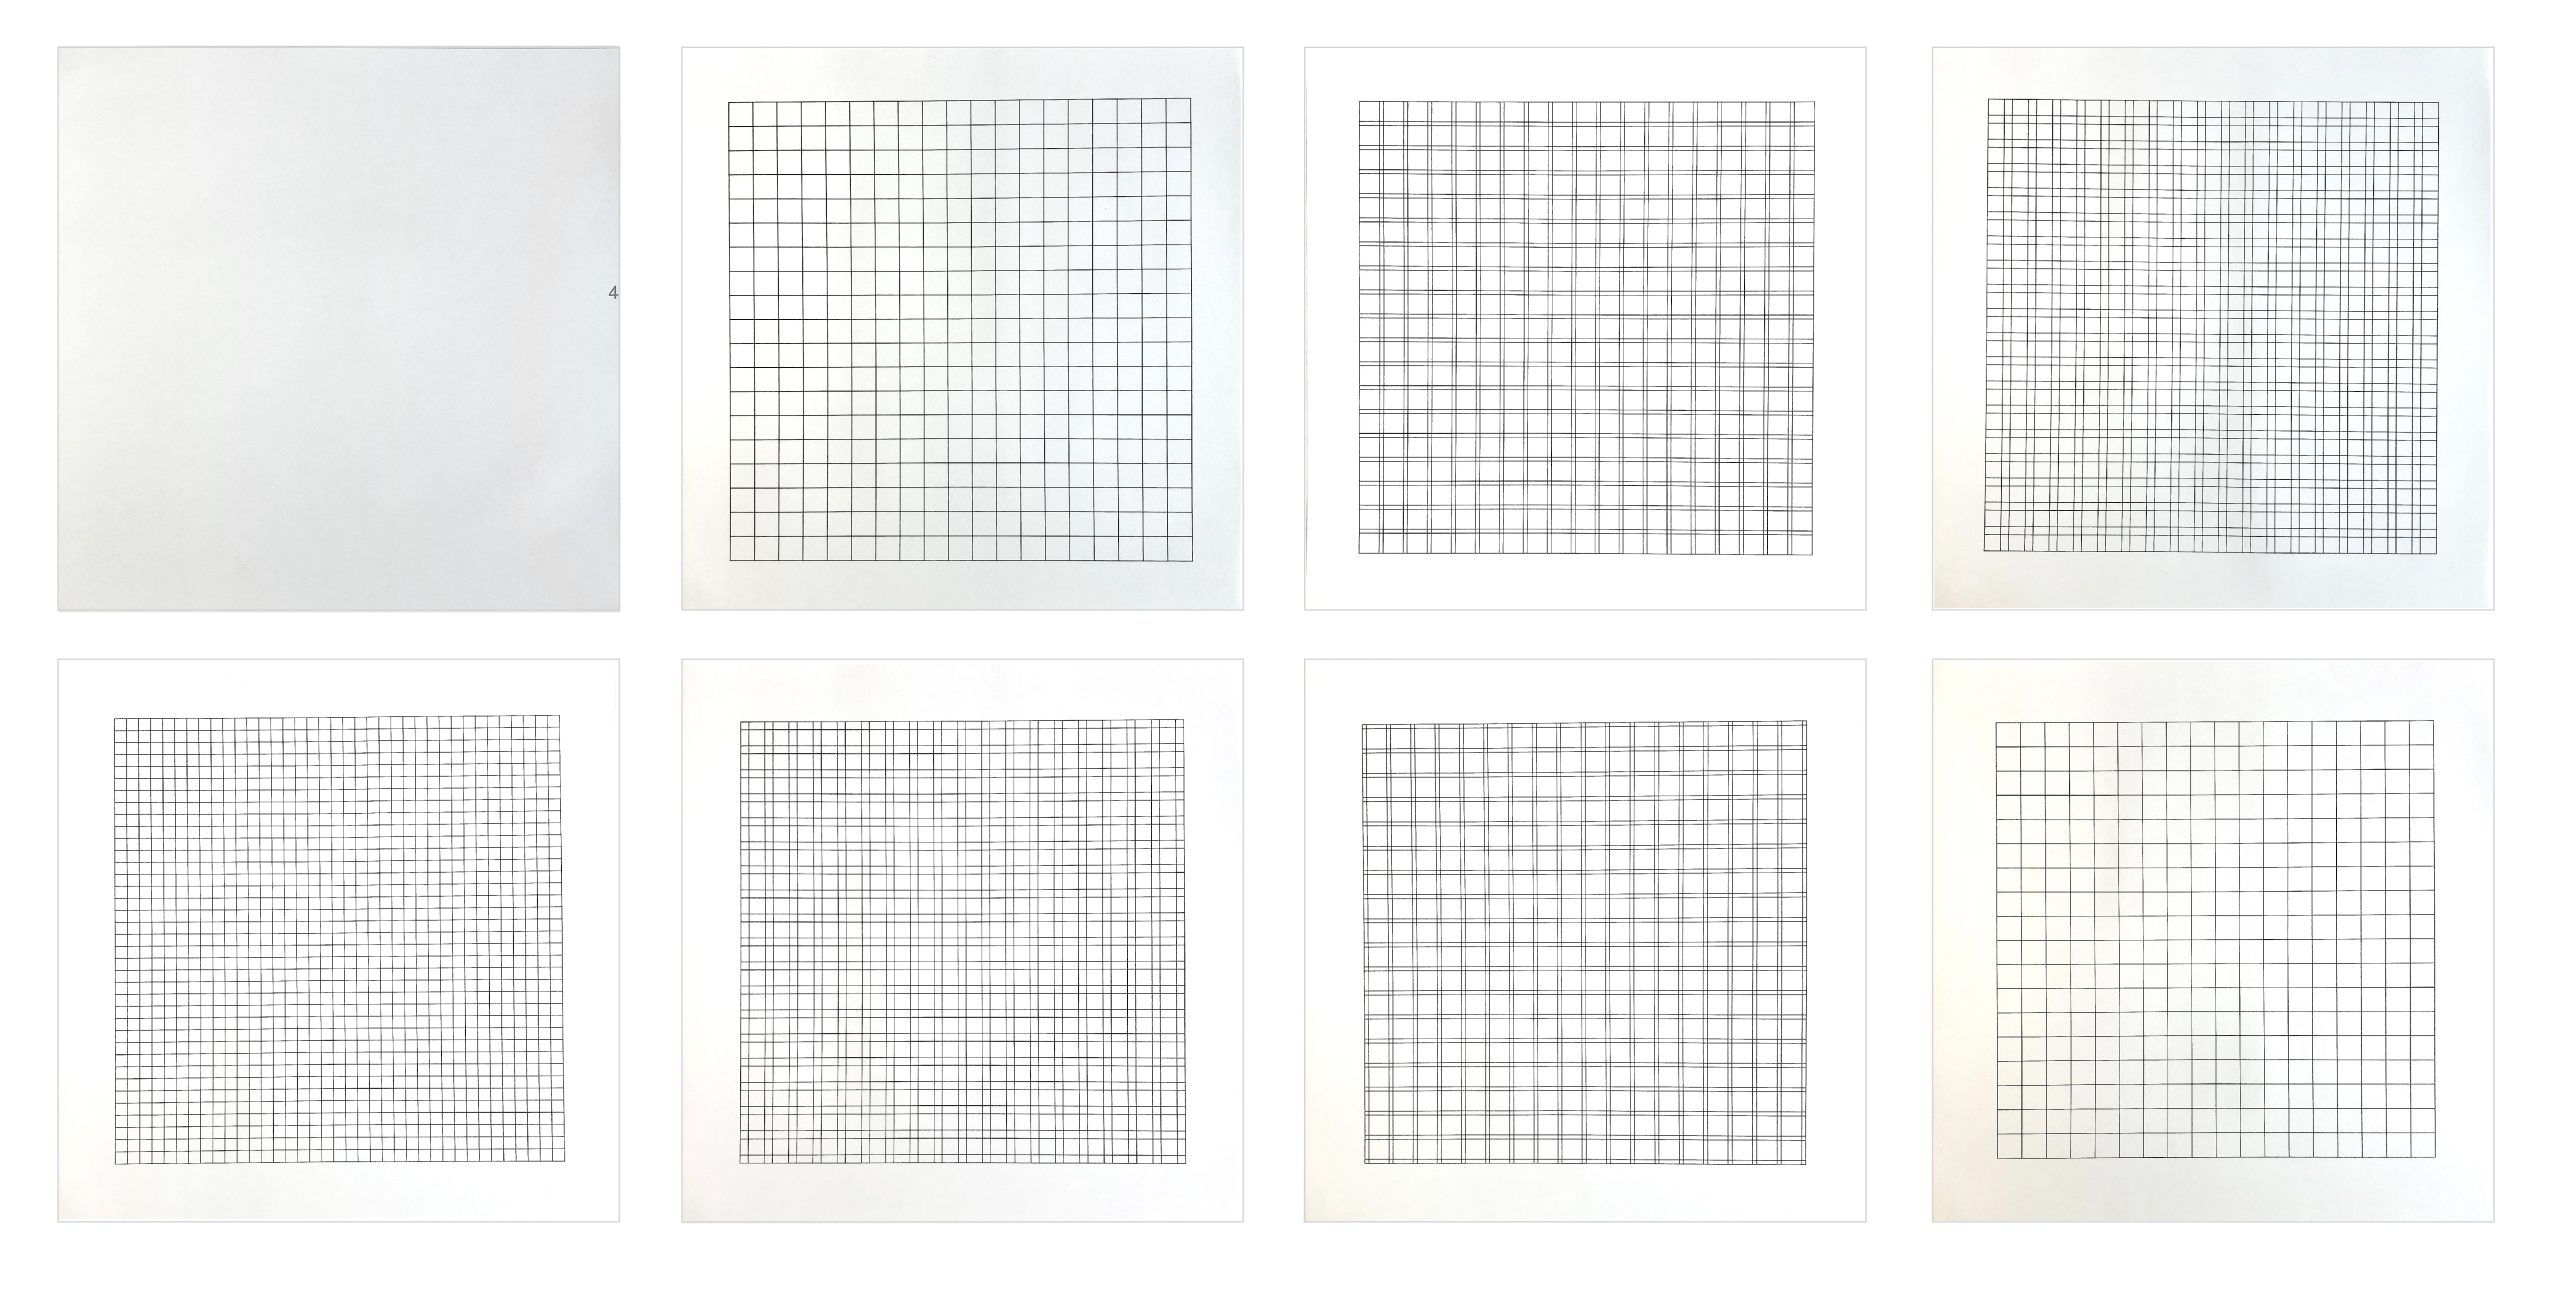
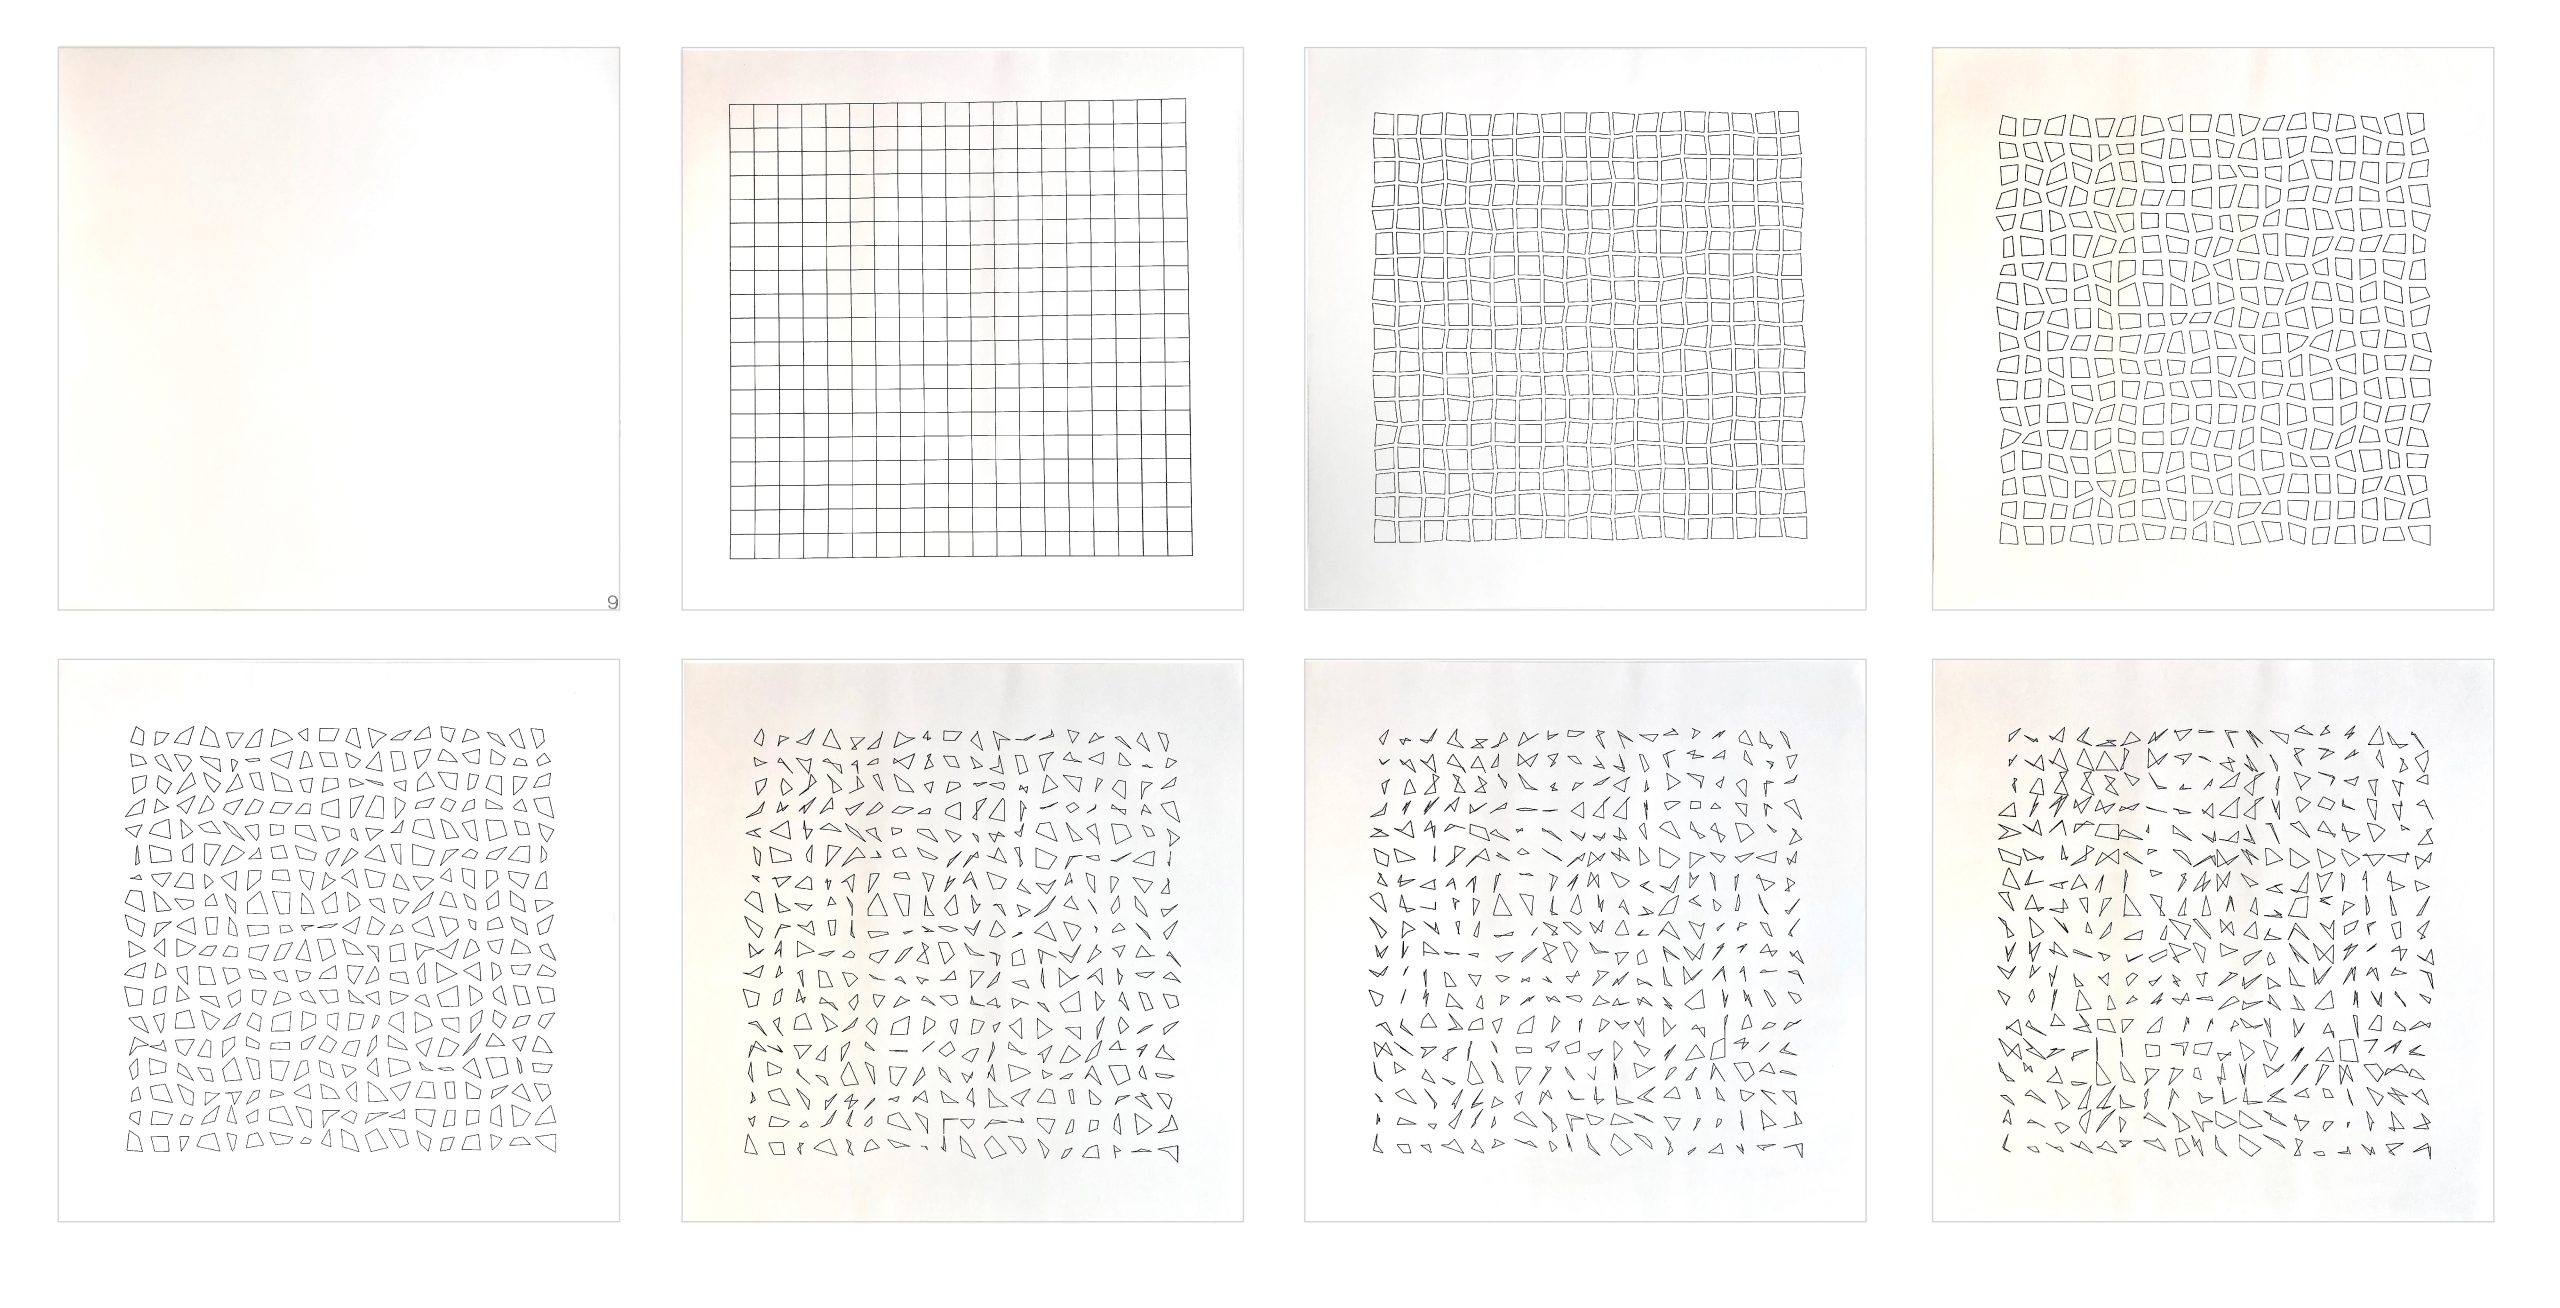
The series consists of 9 parts. Each part shows in 6 steps the transformation of one situation into another, the 6 steps produce 7 drawings.
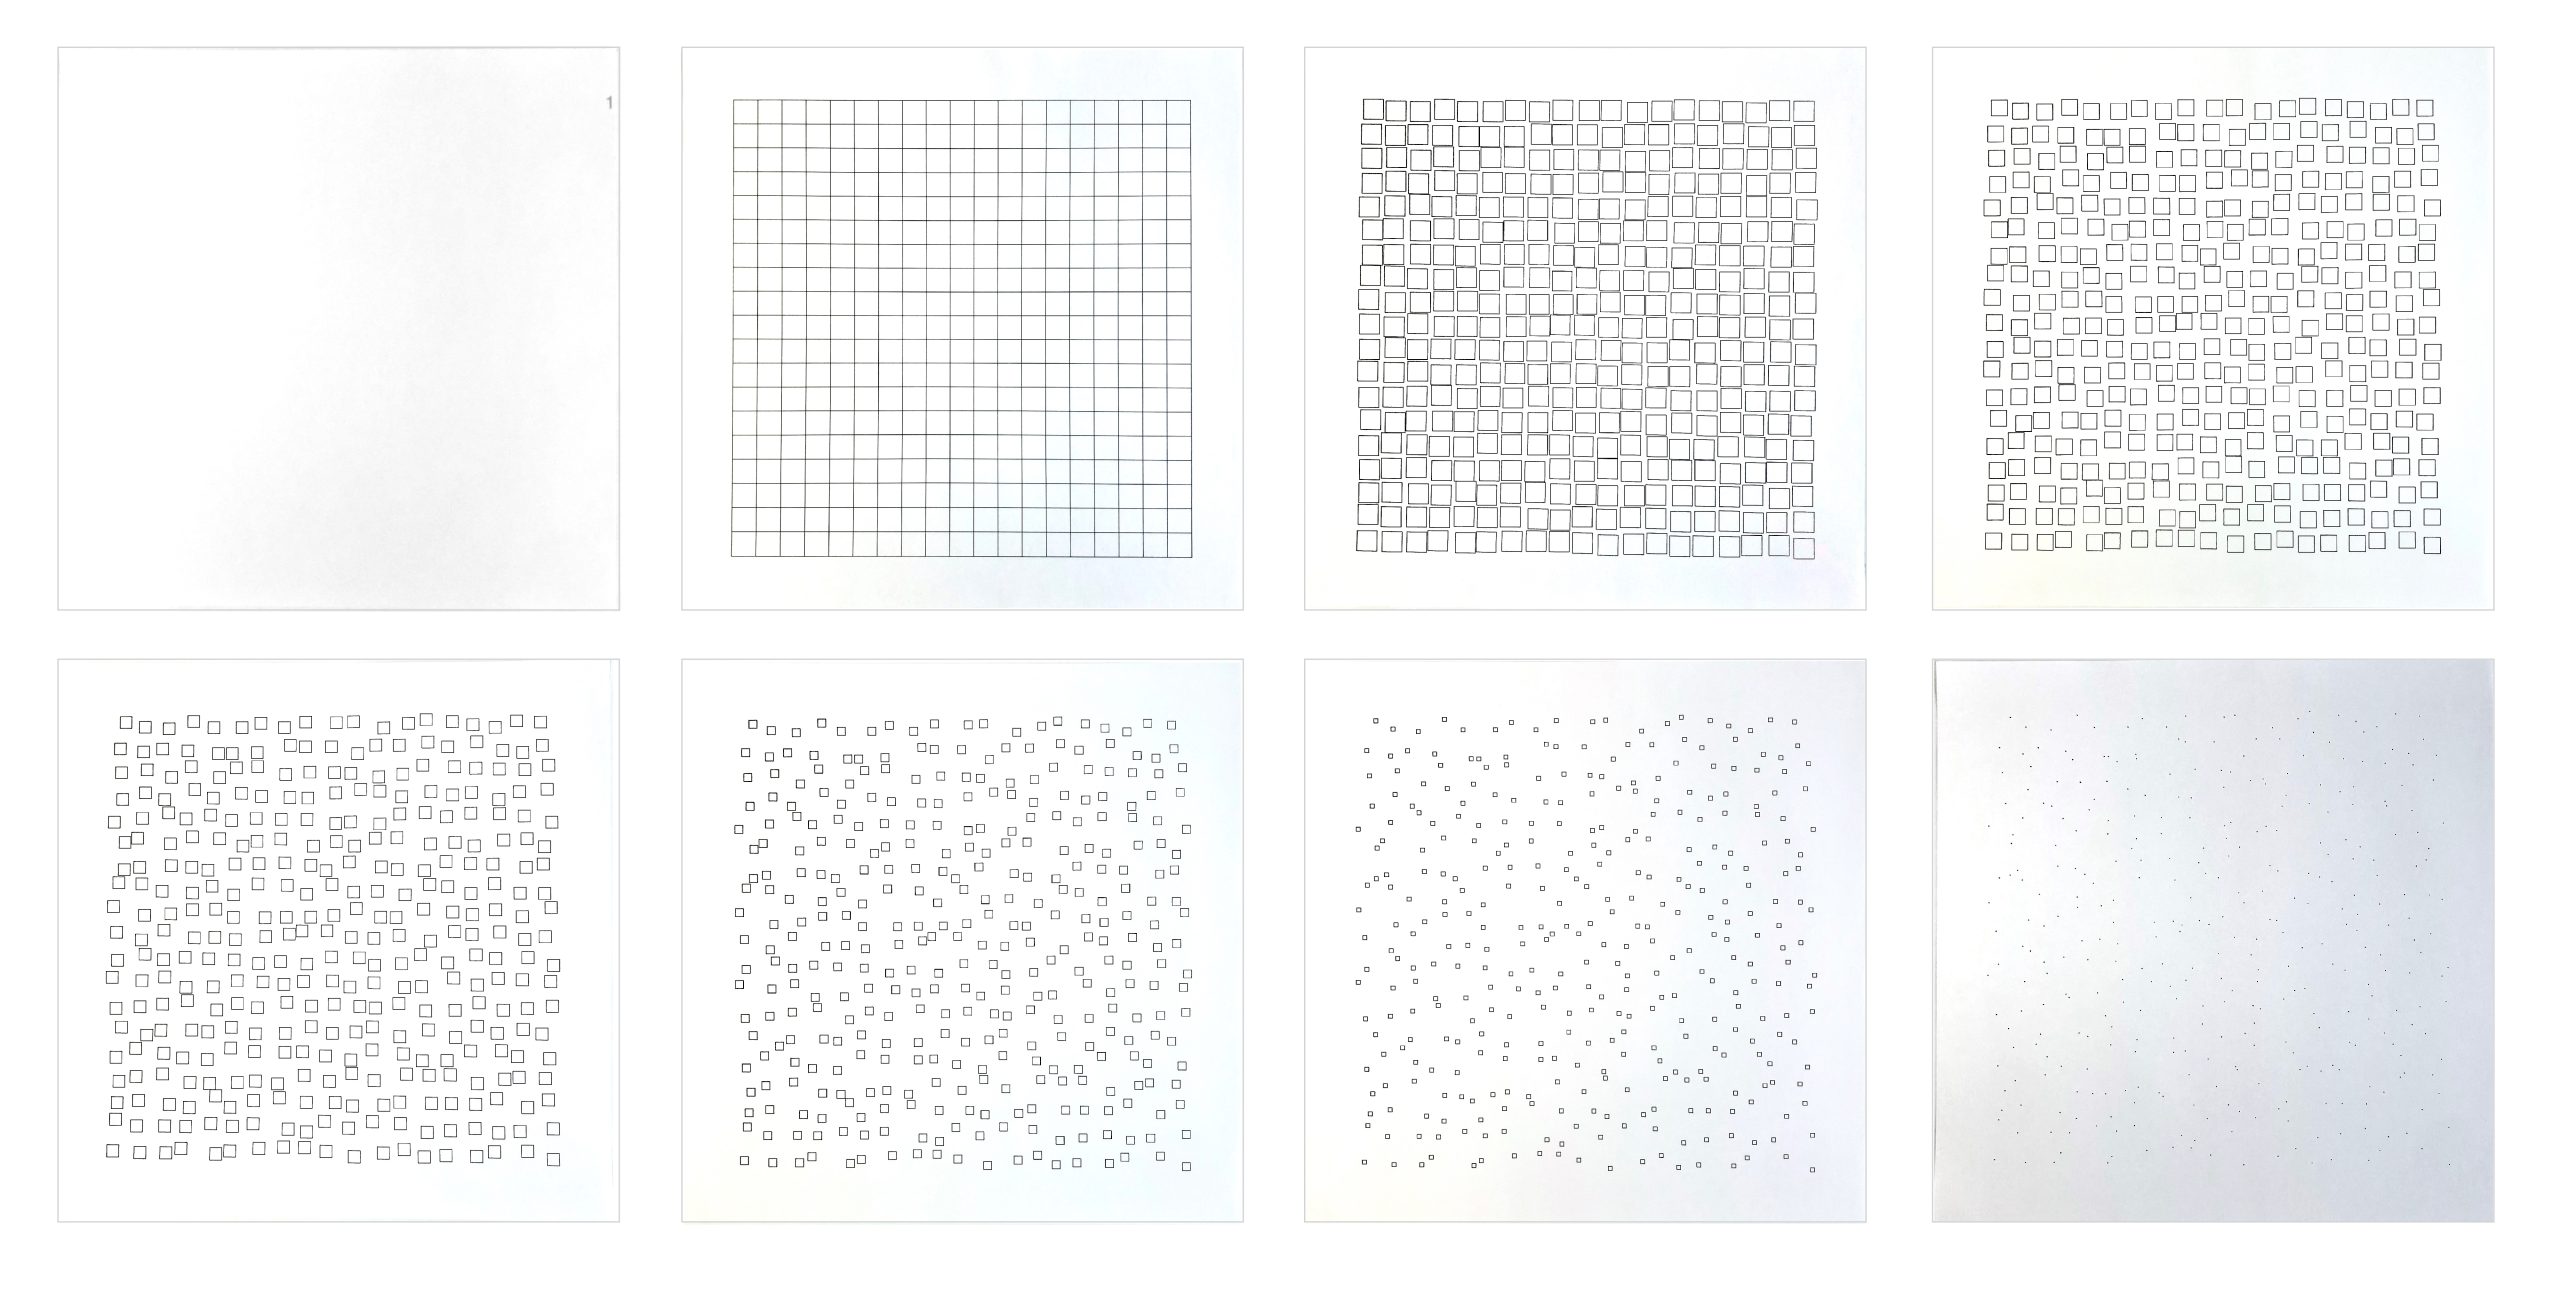
Part 1 Shows the transformation of the raster into the chance distribution of points. The squares shrink in the same degree as their middle point comes nearer to the randomly determined place, which means each by 1/6.
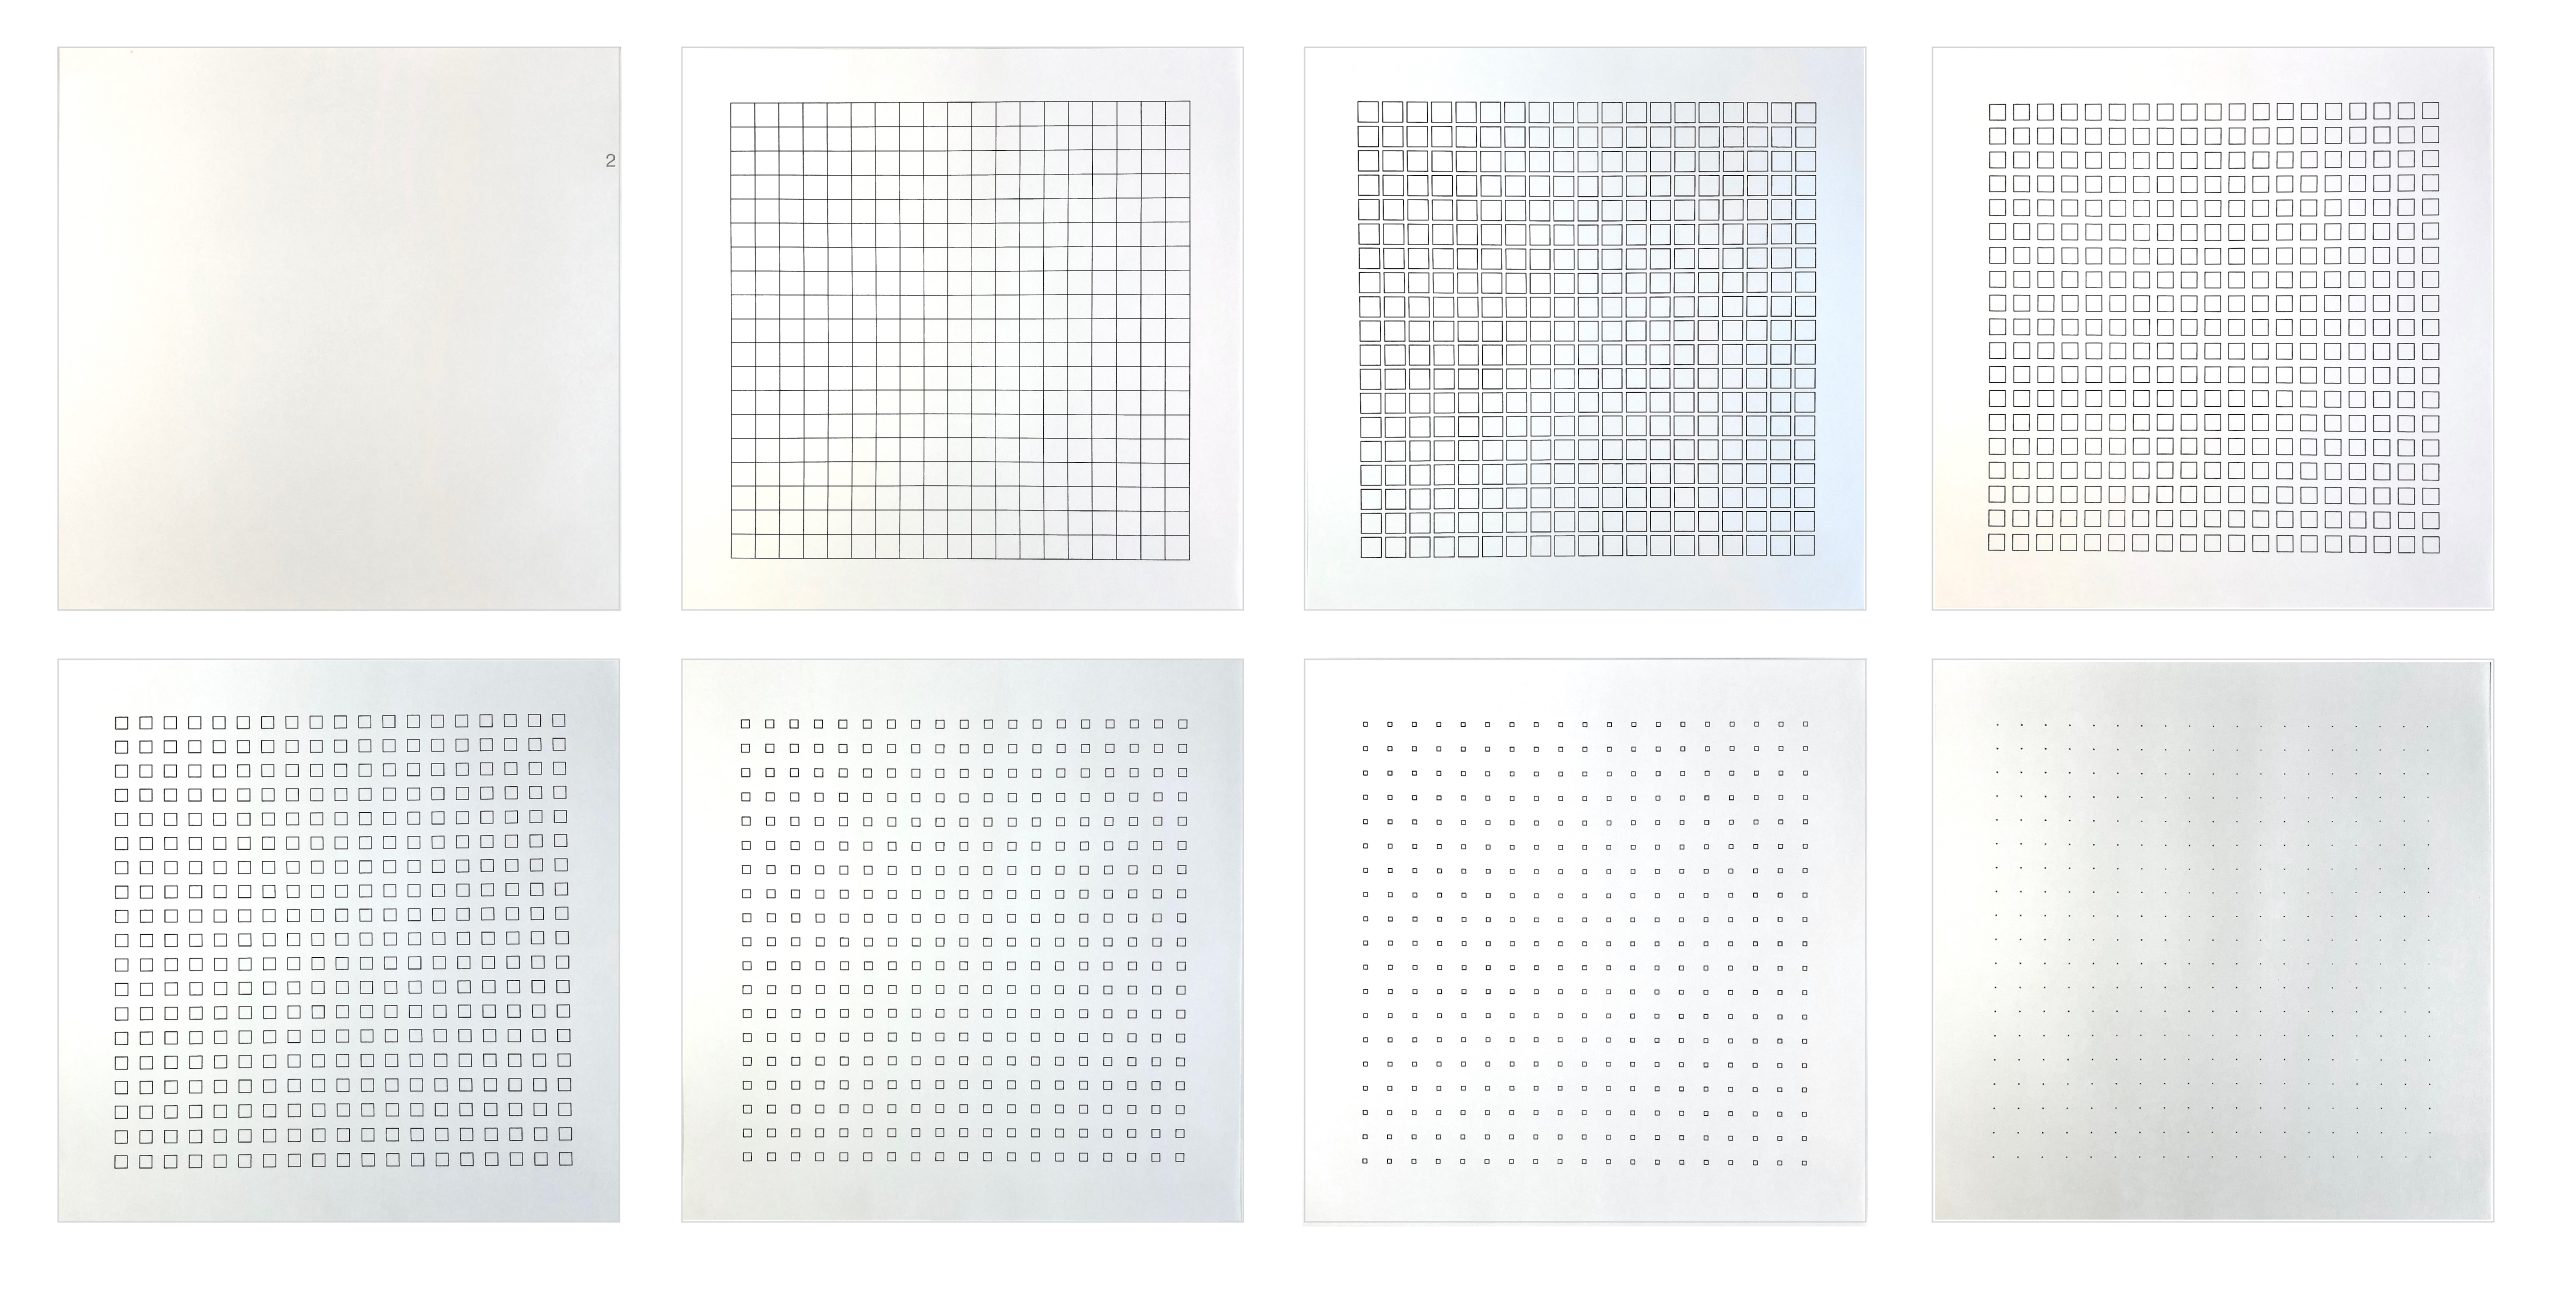
Part 2 The squares of the raster shrink to their middle point.
Part 3 The same process as in part 1 but the points of the edges of the squares are connected by a straight line
Part 4 The same process as in part 2 but the corner points of the squares are connected by a
straight line.
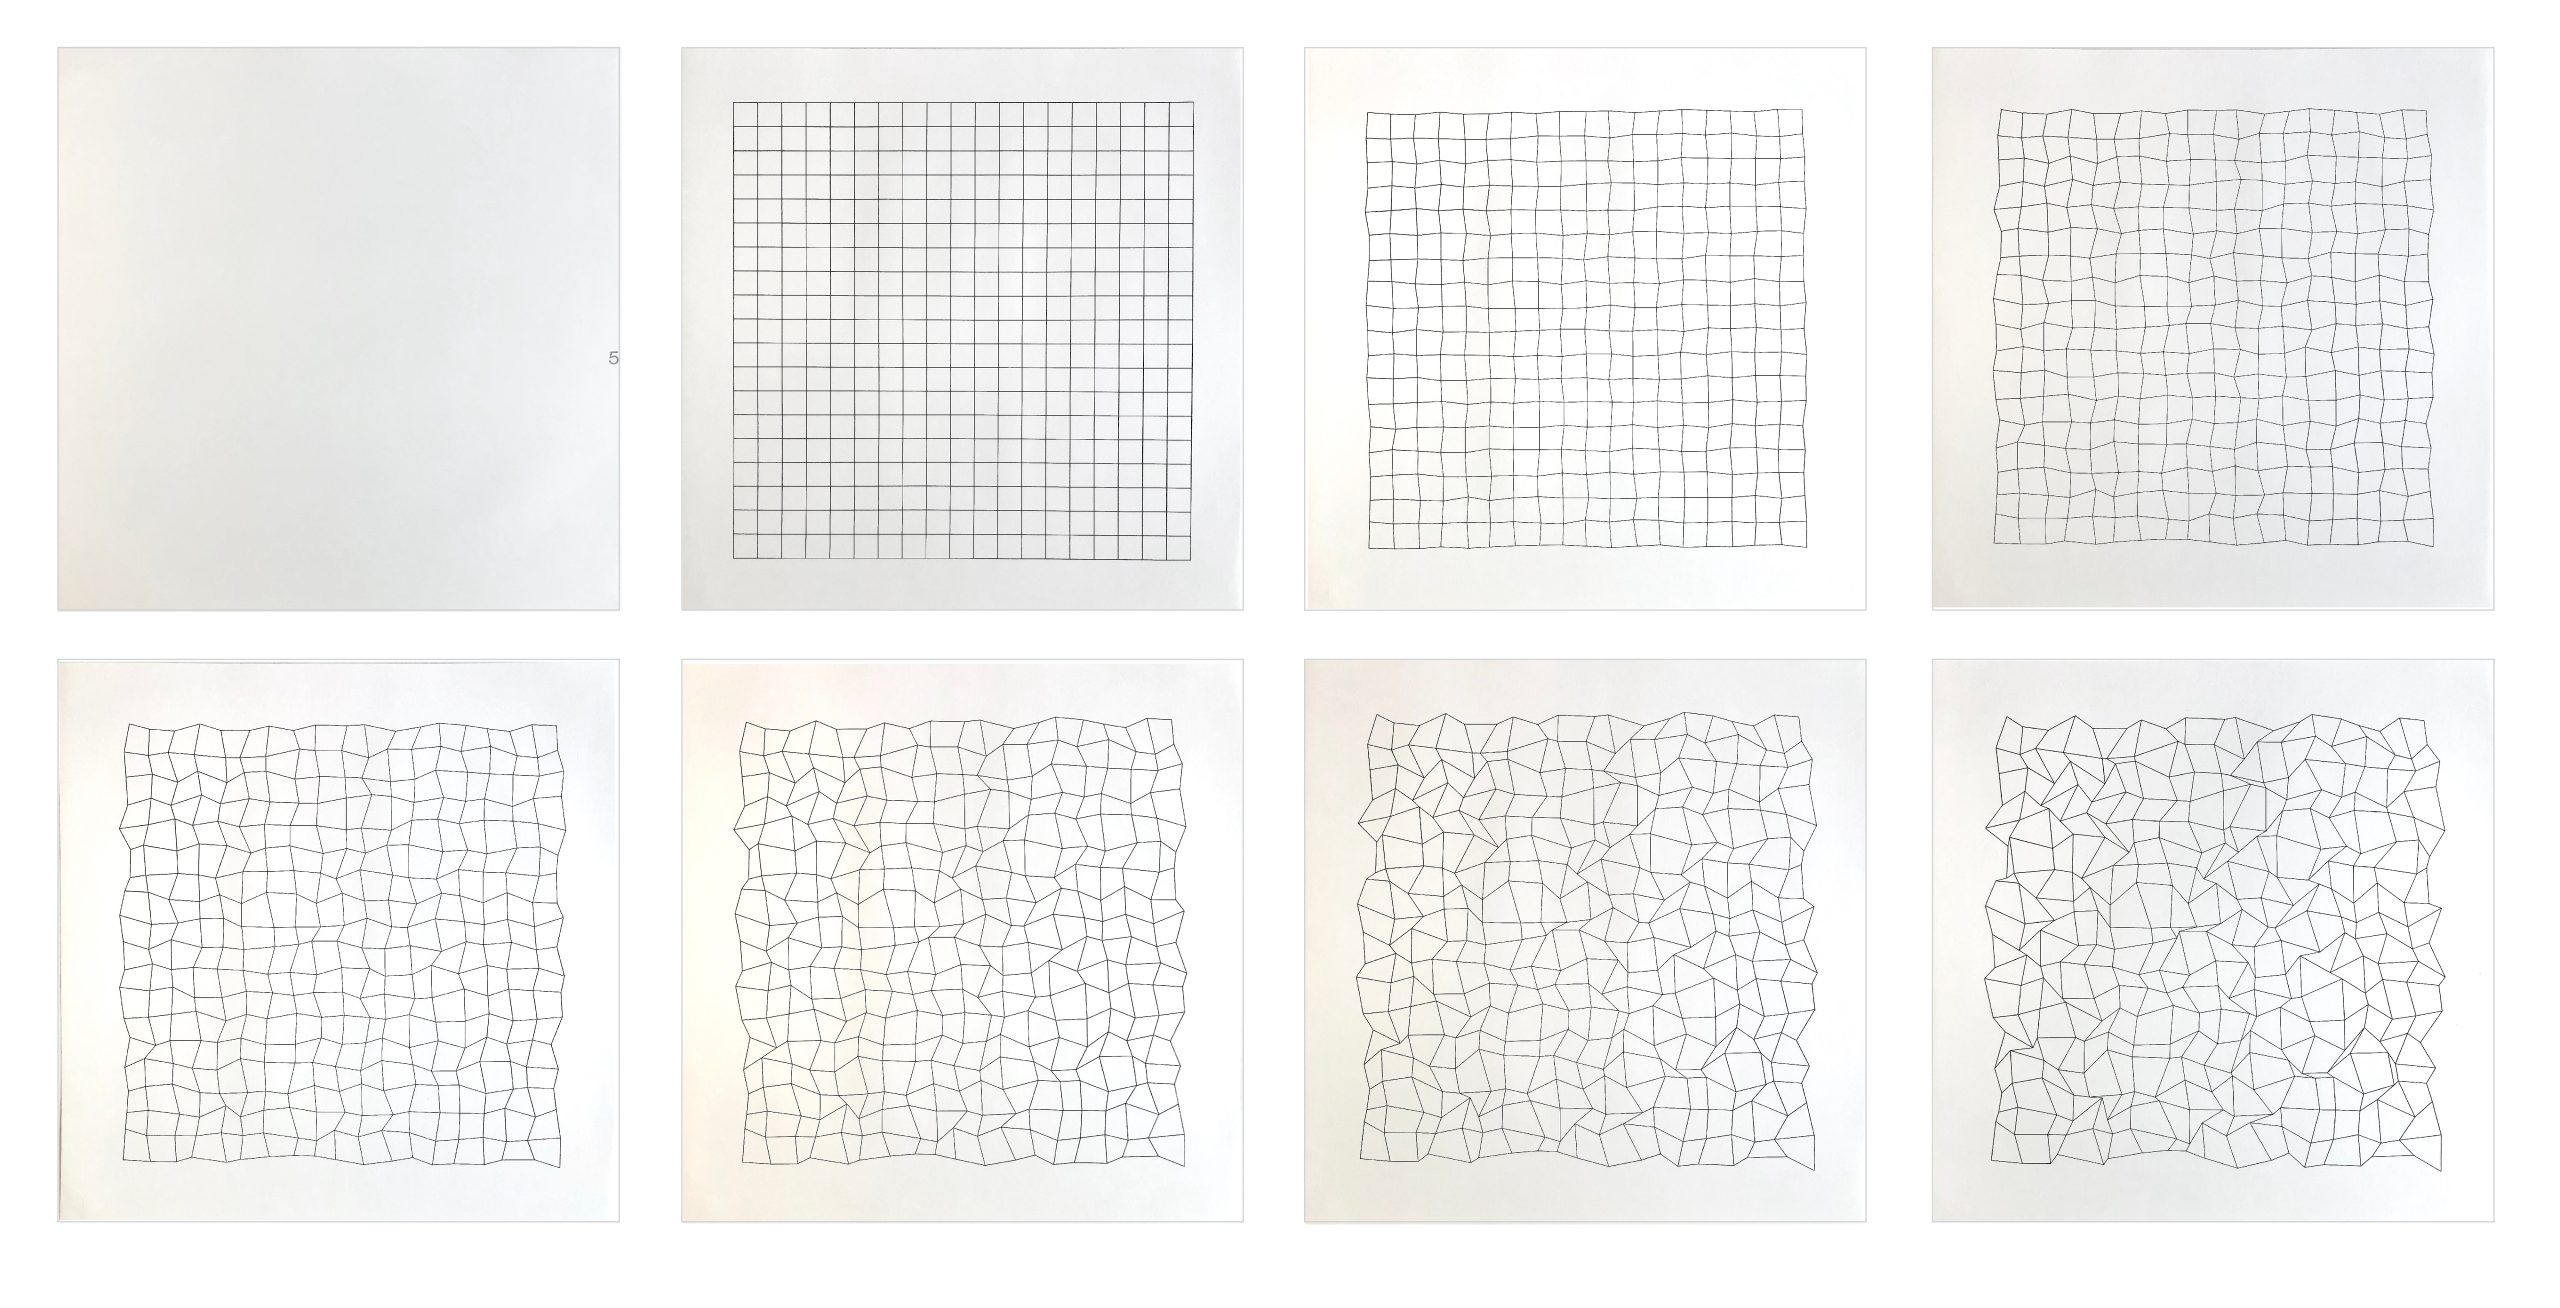
Part 5 Here the middle points of the squares of part 1 are connected with the middle points of
their direct neighbor squares.
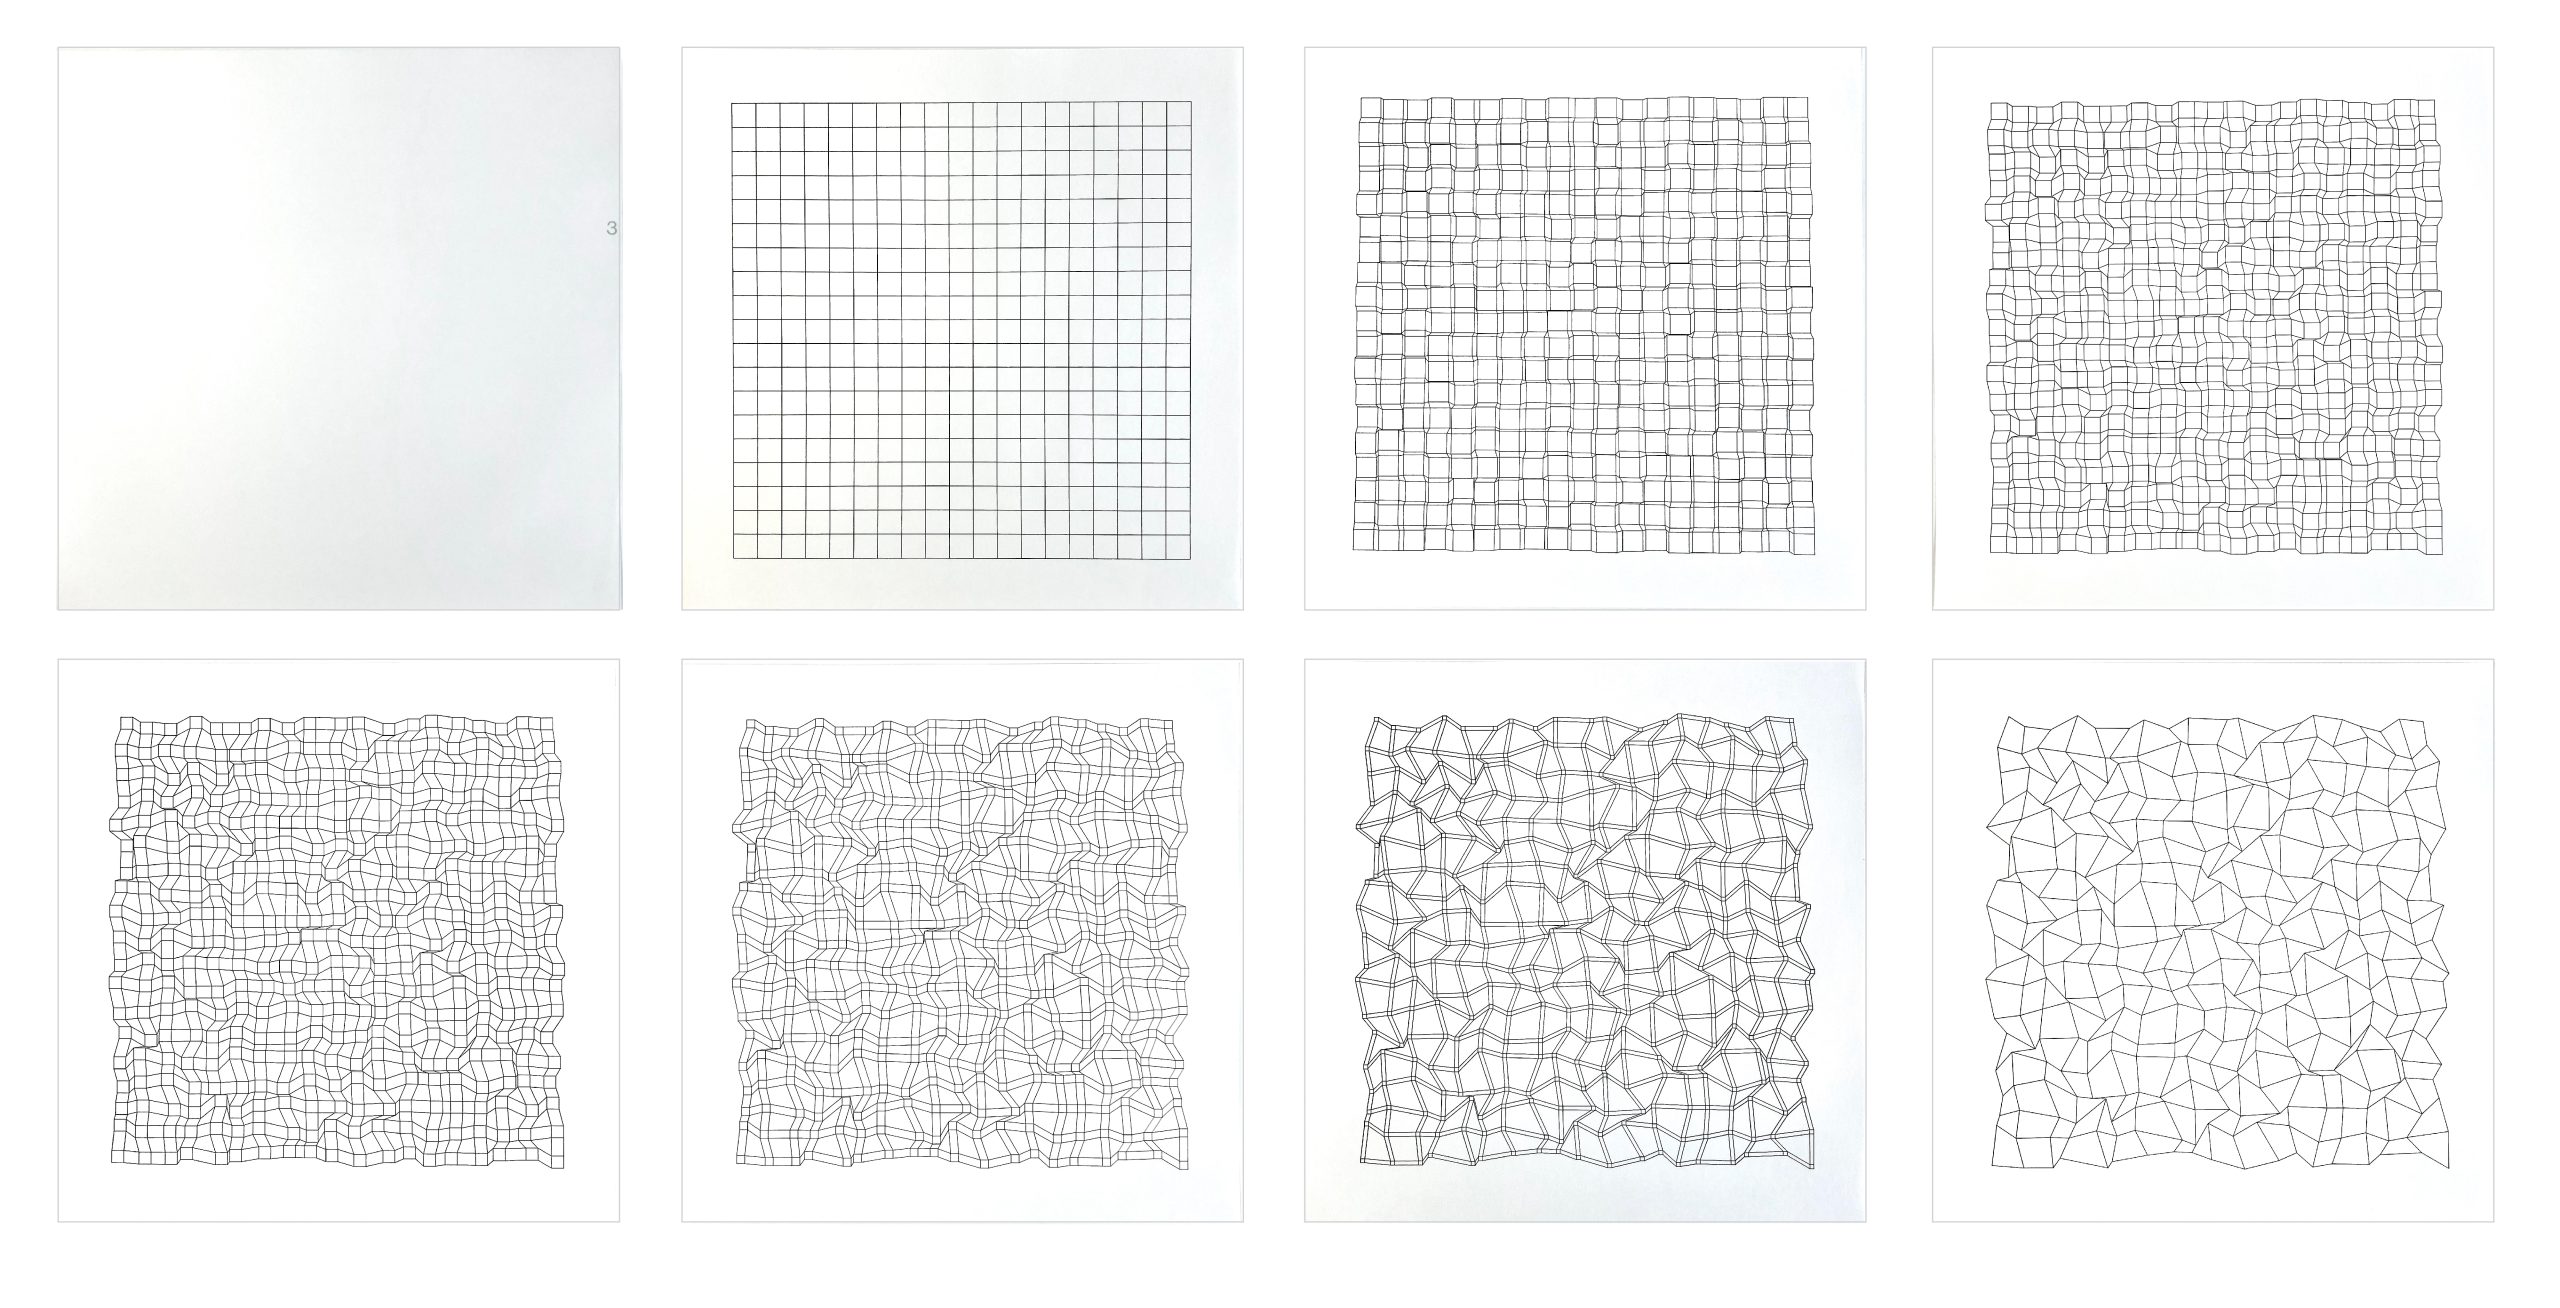
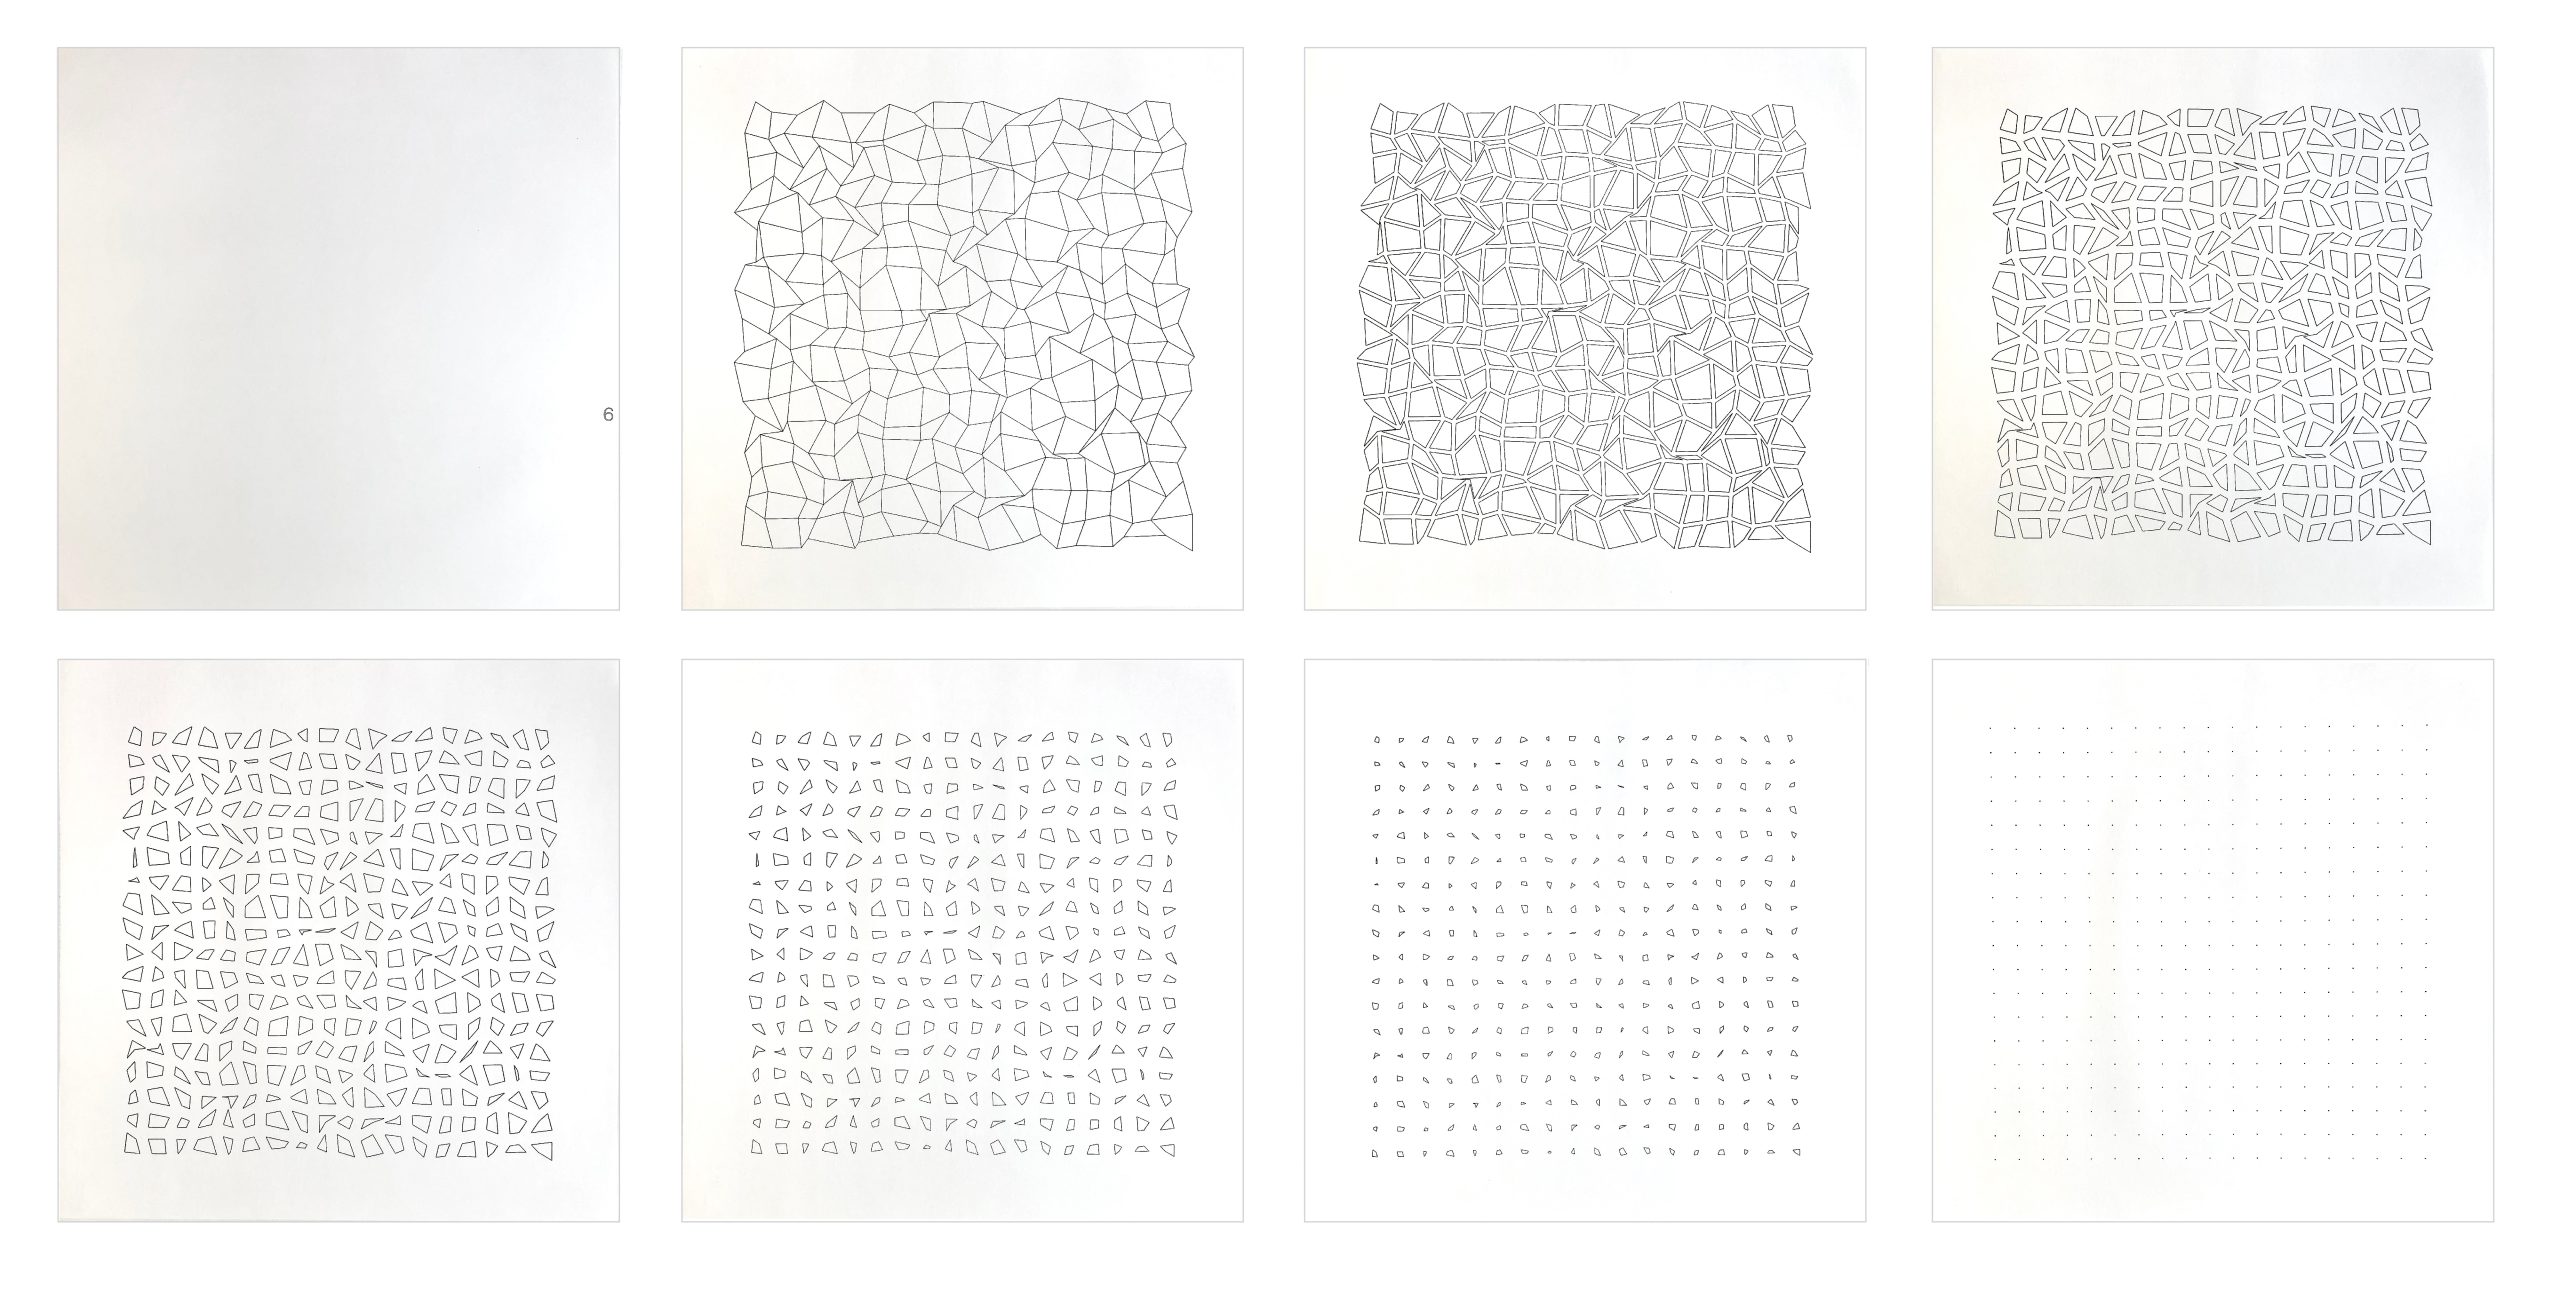
Part 6 The chance distributed points are connected with straight lines and form a pile of irregular quadrangles {or an irregular caster}, each quadrangle shrinks as in part 2 to a point which is identic with the middle paint of the square of the raster.
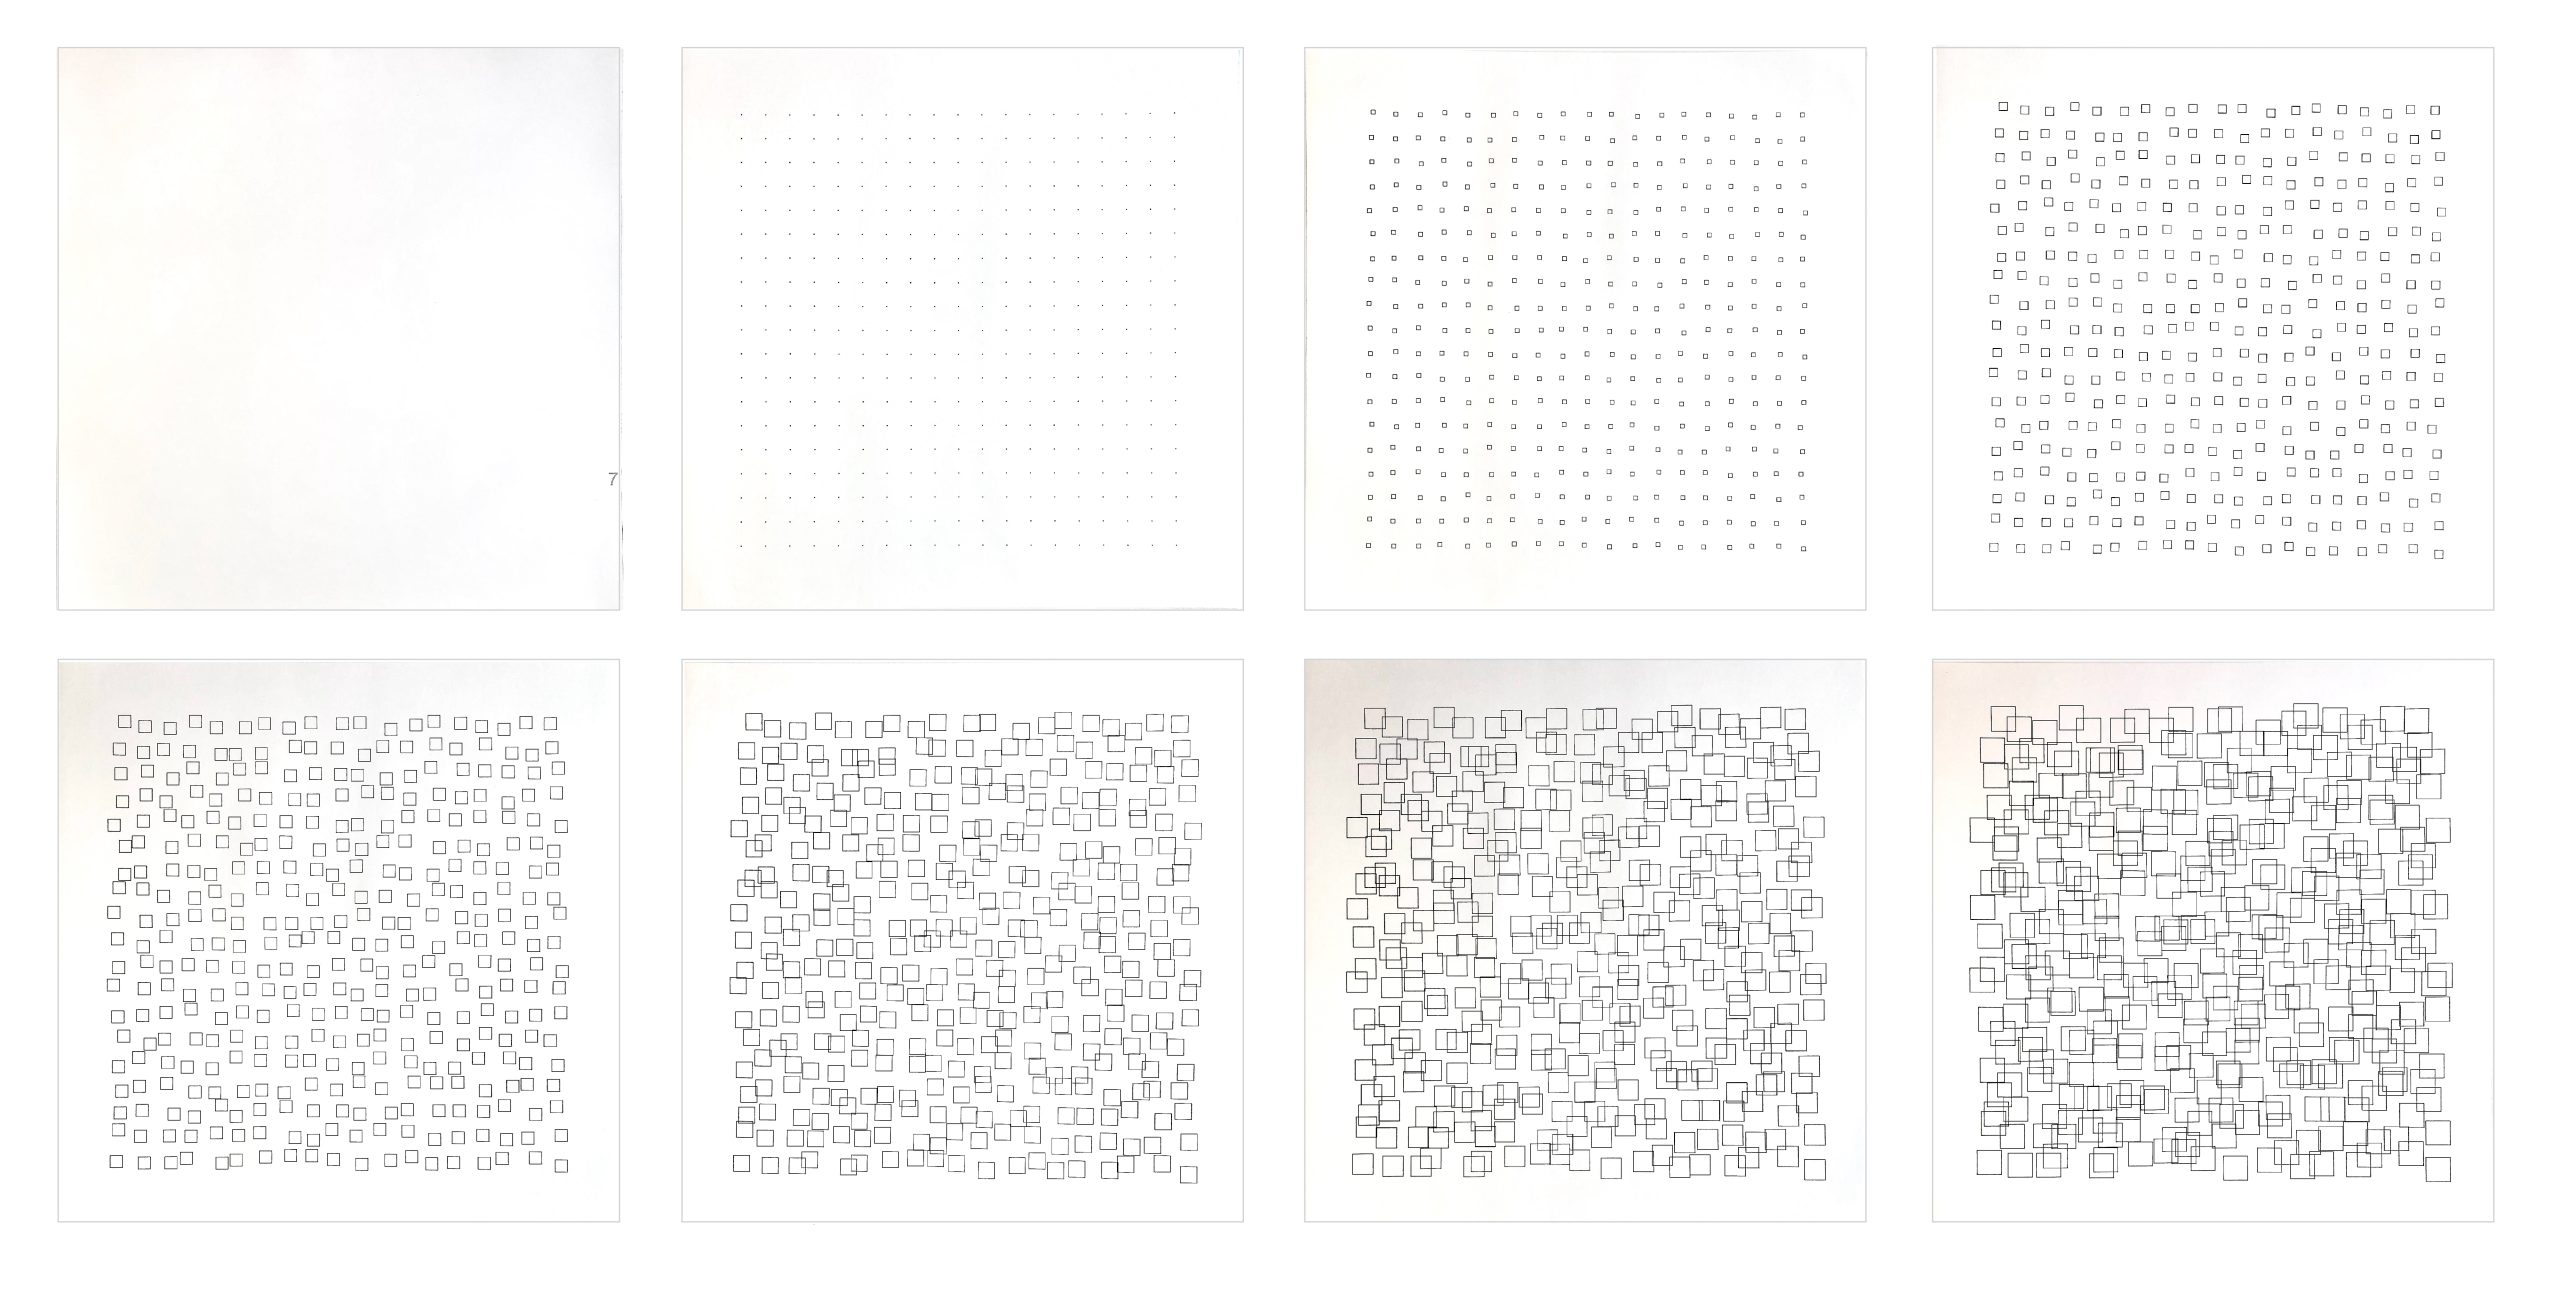
Part 7 The process is the same as in part 1, but it is not started from the squares of the raster but from their middle point and the process of shrinking is changed into a process of growing.
Part 8 The same process as in part 7 but the corner paints of the squares are connected by straight lines.
Part 9 Only the connections of the corner points of part 8 are left.
For most of the drawings a plotter was available. A smaller part is completed by hand. This can cause some small irregularities of the lines.
Gerhard Von Graevenitz
10.10,1979
Detail images of the work


More Artworks By Gerhard Von Graevenitz


